
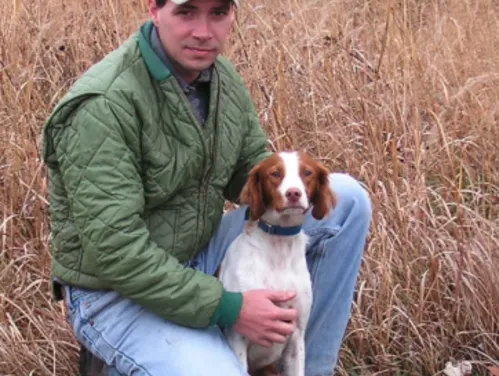
Meet Todd Bogenschutz - Upland Game Biologist
Todd received a B.S. in Biology from the State University of New York at Cortland, as well as a M.S. in Wildlife Sciences from South Dakota State University where he conducted research on pheasant use of winter food plots. After graduation, Todd worked for the DNR’s in Minnesota and Indiana, before becoming Iowa’s Upland Game Biologist. As the upland game program leader, Todd oversees the management and research of Iowa’s pheasant, quail, gray partridge, rabbits, jackrabbits, and prairie grouse. Some of his primary responsibilities include coordinating upland game surveys to estimate population trends annually, reviewing and recommending changes to hunting regulations, as well as developing new research projects and scientific publications.
August Roadside Survey
The August roadside survey is how Iowa DNR's Wildlife Bureau tracks the distribution and trends in our upland game populations. This roadside survey covers over 6,000 miles of rural roads each August and generates data from approximately 225, 30-mile routes on ring-necked pheasants, bobwhite quail, gray partridge, cottontail rabbits, and white-tailed jackrabbits. Counts conducted on cool mornings when the sun is shining, with heavy dew, and no wind yield the most consistent results. Comparisons between 2023 and 2024 are based on routes that are directly comparable between years (routes with no alterations and started with good dew).
It is impossible to know exactly how many pheasants or rabbits are in Iowa as most upland game species are very good at hiding from humans most of the time, but this survey provides a very robust index to statewide population distributions and if the populations are trending up or down. Annual changes in counts are mostly related to annual weather and long term trends are related to changes in habitat.
Classrooms could identify routes in their area or start routes of their own to then compare to statewide trend data. Data sets by county, region, species, and trends are easily generated for specific requests.
Data Set, Graph, Learning Tools
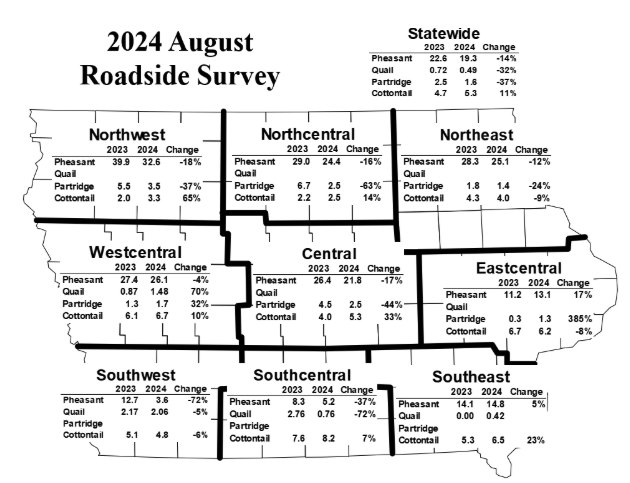
Numbers listed on the map above indicate the average number of animals counted on 30-mile routes in each region (e.g., the northwest region counted an average of 32.6 pheasants per route in 2024).
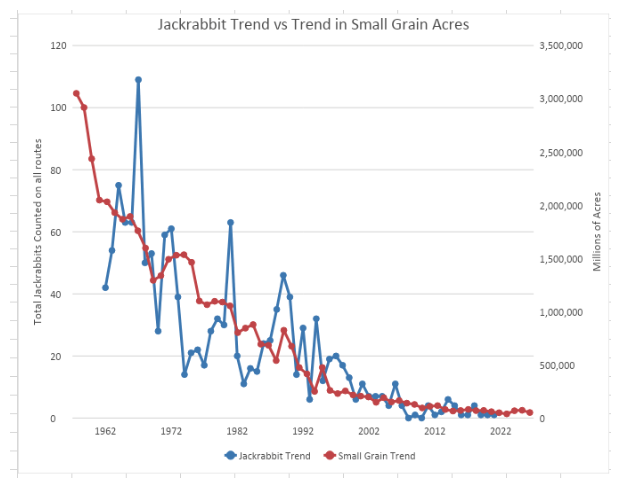
The above chart shows jackrabbit population over the last 50 years alongside the small grain acres. USDA and NOAA reports on farming practices will often directly correlate to wildlife survey data.
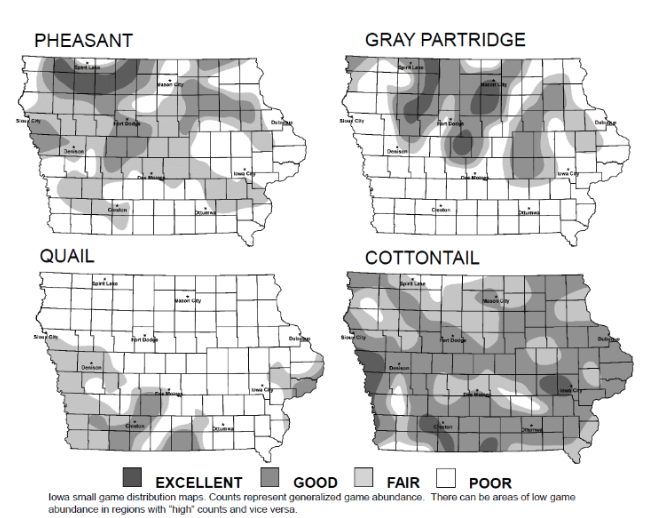
The counts on the above 2023 Iowa small game distribution maps represent generalized game abundance. There can be areas of low game abundance in regions with “high” counts and vice versa.
Learn More
For more information or questions, please contact [email protected]