On this page...
Mapping Data Platform & Documentation
- Iowa Floodplain Mapping Data Platform
- Help Document for Iowa Floodplain Mapping Data Platform
- Iowa DNR Two Dimensional Base Level Engineering (2D BLE) Floodways
- Breaking Two Dimensional Base Level Engineering (2D BLE) Modeling Into Smaller Subunits for Efficiency
- Modeling Parameters
Program Information
The State of Iowa was awarded $15.0 million in Community Development Block Grant (CDBG) Disaster Recovery Funds in 2009 as a result of the devastating floods of 2008. This funding was allocated to the Iowa DNR for the development of new floodplain maps and updating of existing maps for all of the 85 Iowa counties listed in the federal Disaster Declaration of 5/27/2008 (Declaration FEMA-1763-DR).
Iowa had begun collection of LiDAR in 2007 before the 2008 flood; having that dataset available was one of the keys to the program’s success. This $4.3 million project was funded by several state and federal agencies and completed in 2012. At the time, Iowa was one of a few states in the country to accomplish this significant data acquisition task.
In 2010, the Iowa legislature mandated that the Iowa Flood Center (IFC) at the University of Iowa contract with the Iowa DNR for $10 million of the $15 million of CDBG grant funds to map the 85 disaster declared counties. In March 2015, the contract with the Iowa Flood Center was amended to increase the contract amount to $12.5 million, this contract ended in December 2016. To update floodplain mapping for the remaining 14 non-disaster declared counties, state funding and leveraging of state resources with the Army Corps of Engineers Section 22 Public Assistance to States (PAS) program was used. Two Section 22 PAS agreements between the Iowa DNR and the U.S. Army Corps of Engineers have been executed: September 21, 2011 (for eleven countywide floodplain work maps); and June 28, 2012 (for one countywide floodplain work map). Development of flood hazard data for the two remaining non-declared counties was funded with non-grant state funding. The $15 million CDBG grant has been completely expended as of December 31, 2016 – and has been closed out by the State of Iowa Economic Development Authority.
Starting in 2020 the Iowa DNR floodplain mapping program began a new effort to identify flood risk in the State of Iowa using Two-Dimensional Base Level Engineering (2D BLE). This new approach to modeling considers both fluvial (riverine) and pluvial (stormwater) factors when determining risk. Having new LiDAR for the State made available through efforts by NRCS and FEMA, Iowa DNR was able to secure funding to map the entire state with 2D BLE. Kickoff meetings (virtual) were held in 2022 and 2023 across the state to introduce communities to the project. In 2023 and 2024 modeling was completed and more focused HUC8-wide outreach was conducted with Iowa communities providing and opportunity to review the data and consider how it could be used for planning purposes.
Having completed modeling for the State, the Iowa DNR floodplain mapping program has begun to work with FEMA to update regulatory mapping in areas with the most out of date maps. Factors such as age of effective modeling or recent and planned community development are considered when determining where new maps are needed in order to supply communities with the best understanding of their flood risk as they plan for future development.
Iowa Floodplain Mapping Data Platform
Our mission is to raise awareness and increase resilience through mitigation. This will be accomplished by applying the latest engineering and mapping methodologies, along with outreach and community engagement, to accomplish the following goals:
- Improve Risk Reduction through Mitigation Empower individuals, organizations, and communities to take steps to increase resilience by highlighting areas of high risk and pinpointing locations that are ideal for mitigation projects in order to be prepared for future flooding events
- Increase Resilience Make Iowa more resilient so that when future floods occur, citizens and communities will be able to recover more quickly with reduced loss of life and property
- Improve Floodplain Management Enhance cooperation and information sharing among floodplain partners and professionals, encouraging smart growth for future development, transportation improvements, infrastructure enhancement, and agricultural systems
- Enhance Natural Resources/Quality of Life Enhance natural resources protection through the ethical stewardship of floodplains, resulting in reduced economic and social hardships, enabling smart economic development, improving historic preservation, and promoting environmental quality through stronger ecosystem habitats
Iowa DNR’s Statewide Two-Dimensional Base Level Engineering (2D BLE) information is free to the citizens of Iowa, our project partners and other professionals who may want to use this data in various project planning efforts.
- Infrastructure Improvements
- Mitigation Planning
- New Development
- Stormwater Planning
- Agricultural Development
- Natural Resource Systems Restoration
The Data Platform will ultimately allow users to contact Iowa DNR staff, access data for download, view results of modeling through web-based mapping, run modeling scenarios and to answer “what if” questions.
The Floodplain Mapping Program began a project for developing a new kind of flood risk data known as two-dimensional base level engineering (2D BLE) in 2020. As development and other changes occur, flood risk data requires updates in order to provide accurate, up-to-date risk awareness. Mapping methodologies also change over time. Flood risk awareness data is shifting from binary (in the floodplain vs. not in the floodplain) to a graduated risk analyses paradigm. This will help to better understand flood hazards, to more adequately rate flood insurance, and to improve planning for mitigation. Graduated risk means utilizing a greater range of event recurrence and/or storm variability in order to better define flood hazards and associated risk, as opposed to simply evaluating based on the 1% (100yr) risk. This information along with proximity to flooding sources, depth of flooding and replacement value of structures provides a better picture of where actual risk of flood events is. Development of base 2D BLE hydraulic modeling will provide the foundational data that will be used for future FIRMs, probabilistic analysis for graduated risk, and data bundling that allows others to work with the data to answer “what if” questions. Instead of providing modeling related to flood insurance requirements only, this data will deliver both predictive capabilities and can be used to regulate if a community so chooses. Goals of the 2D BLE mapping project are listed below:
- Improve Risk Reduction through Mitigation
- Increase Resilience
- Improve Floodplain Management
- Enhance Natural Resources/Quality of Life
2D BLE is a major improvement over 1-dimensional (1D) modeling although some portions of the inputs remain similar. The major difference is that 1D methodologies are tied to a profile baseline and cross sections to determine risk while 2D BLE is not. The profile baseline is restricted to a drainage area of greater than 1 square mile and some semblance of a stream to collect water. The models show what happens when the water from a flooding event reaches the profile baseline (stream). This makes modeling for lakes difficult and does not represent overland flooding scenarios.
2D BLE is not confined to the profile baseline and cross sections. It instead takes a whole surface into account. This modeling uses 2D rain-on-grid made possible by HEC-RAS 6.0 software and subsequent updates, which relies on a user defined mesh and high-resolution terrain data to capture the flow of runoff through an entire watershed. By using newly acquired LiDAR (2019, 2020, 2021) a more up-to-date picture of flood risk can be realized.
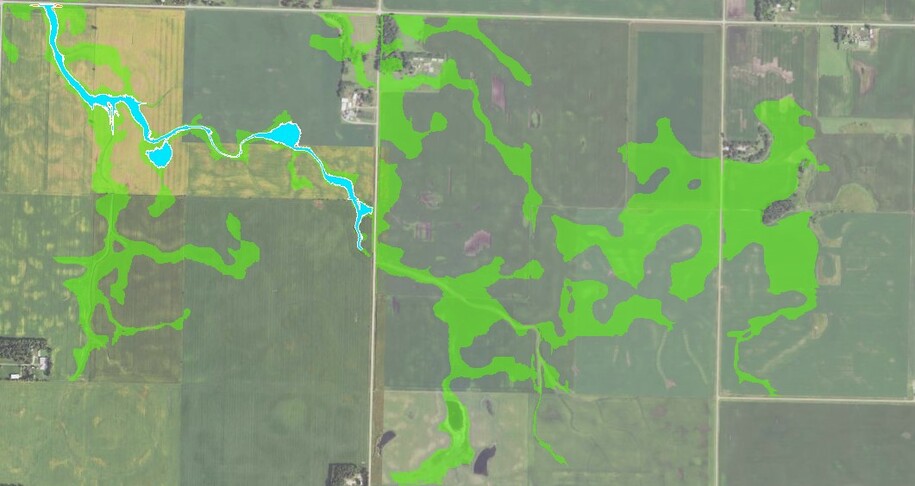
Figure 1

The result of taking the whole surface into account is a more comprehensive understanding of flood risk due to pluvial flooding (overland flooding not tied to streams) as well as fluvial (stream/river) flooding. In vast flat areas where there is not a defined stream there are paths the water follows that experience flash flooding. While not as costly as fluvial flooding that goes through cities (often located near rivers), pluvial flooding is nonetheless a risk for road access and emergency response related issues. This information can be used for stormwater management strategies by communities as well when planning for development.
Figure 2
The new risk data will benefit communities by providing more comprehensive understanding of the flood risk in areas under consideration for future development, both in cities and rural housing developments. Through smart planning and coordination, development can start or continue in an area with an eye to the future - risk can be planned for and mitigated. This information will be free to all of Iowa and can be used as best available data by jurisdictions, if they choose to use it for regulatory purposes. In cases where a jurisdiction decides it would like its regulatory mapping updated with the 2D BLE product Iowa DNR will work with them to help with that process. Risk data products listed below are developed as part of the 2D BLE process:
- Raster format data for analysis through GIS
- Water surface elevation (WSEL) grids for floodplain management/emergency response
- Potential for cumulative rise/change calculations during development planning
- Velocity grids for better understanding of the damage potential flood risk may bring
- Distance times velocity calculations for floodway determination
- Shear stress calculations for determining areas at risk for soil or bank scour
FEMA Cooperating Technical Partner for Excellence in Outreach and Communications Story Map.
The Iowa DNR learns of the need to restudy streams, and do new studies where they don’t exist, through outreach events attended by local officials. When the Iowa DNR learns of a need they put it in the annually updated CTP Business Plan in order to ask for grants from FEMA.
Outreach is an essential part of the success of this project. Robust outreach has been effective in limiting appeals and will be important in promoting stakeholder acceptance of the 2D BLE data for wise planning and development. A series of webinars focusing on mitigation and risk awareness will has been held by geographic footprints (HUC8 boundaries) for local stakeholders as well as a separate series for larger statewide or federal partners. These meetings served as an introduction to the project to communities and other organizations and a first review of the data with no emphasis on floodplain regulation. As modeling has been completed and mapping results have started to be available for review, Draft Map Distribution and Partner Review has taken place which was very similar to Draft Flood Hazard Meetings that the Iowa DNR already performed for new mapping during the 1D effort. These meetings will provide an overview of mapping results and inform partners on how to access any data that is available for review or use.
Floodplain Mapping Contacts
- Chris Kahle, Floodplain Mapping Coordinator/CTP Program Manager,
Chris.Kahle@dnr.iowa.gov, 515-322-7292 - Jesse Soukup, GIS Analyst, Jesse.Soukup@dnr.iowa.gov, 515-490-5965
- Chad Billings, Flood Plain Engineer, Chad.Billings@dnr.iowa.gov, 515-601-2035
National Flood Insurance Program (NFIP) Contacts
The Iowa DNR is the state coordinating agency for the National Flood Insurance Program (NFIP) and provides assistance to local communities that participate in the NFIP.
- Jason Conn, State NFIP Coordinator, Jason.Conn@dnr.iowa.gov, 515-782-8104
- Ken Bouma, Local Floodplains Program, Ken.Bouma@dnr.iowa.gov, 515-783-5811
- Adrienne Ricehill, Local Floodplains Program, Adrienne.Ricehill@dnr.iowa.gov, 515-725-8342
County-wide Flood Insurance Rate Maps (FIRMs)
During the flooding of 2008 the State of Iowa became aware of the need for up-to-date flood risk data for emergency response and flood preparation for communities. Nearly a third of the counties in the state were without Flood Insurance Rate Maps (FIRMs) while nearly half were working with data that was 20 - 30 years old. This data was out of date due to development, changes on the landscape and increases in stream gage (flow) information. This made growth difficult for those communities with older mapping as it was unreliable for permitting and floodplain management.
The Iowa Department of Natural Resources (Iowa DNR) responded to this need by applying for a Housing and Urban Development (HUD) grant and began responding to the lack of flood risk data with the initiation of the Statewide Floodplain Mapping Program in 2010. This was possible because Iowa had already begun collecting Light Detection and Ranging (LiDAR) data in 2007. Collection of LiDAR data was completed in 2010. The Federal Emergency Management Agency (FEMA) requires LiDAR for all new regulatory mapping. Fourteen years later the main goal of this program, to provide digital flood risk data and updated mapping based on LiDAR to all communities in the state, is nearing completion. Preliminary mapping has been completed for all county-wide FIRMs for the entire state. Statutory review and appeal periods remain before some counties can be issued FIRMs.
